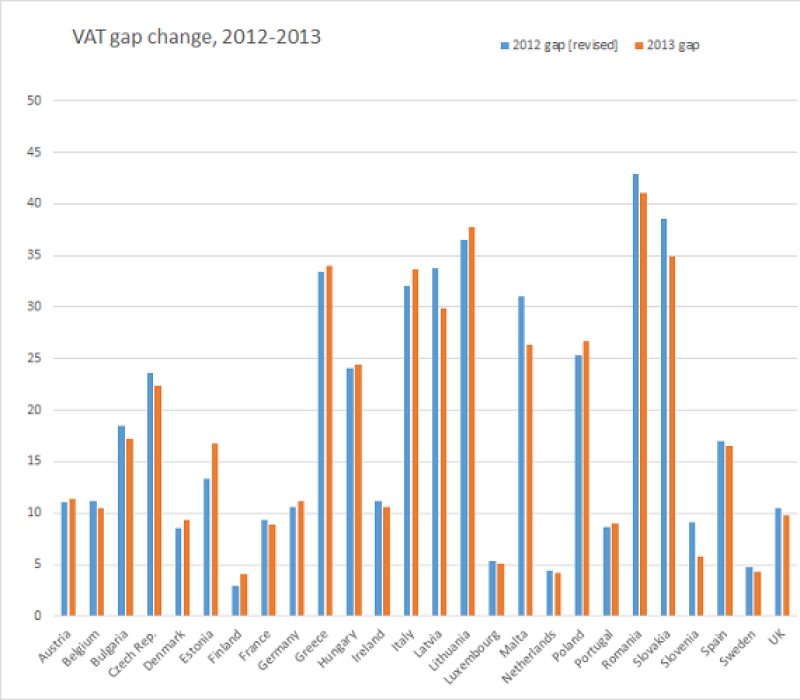
The study, which is published yearly by the European Commission (EC), showed that Finland has retained its title as the EU member state with the lowest level of VAT leakage while Romania, despite improvements, has remained the worst, with a ‘VAT gap’ 10 times higher than that of Finland.
“This important study highlights once again the need for further reform in VAT collection systems across the EU,” said Moscovici.
The ‘VAT gap’ is the difference between the amount of VAT collected and the VAT total tax liability (VTTL) – the estimated amount of VAT collectible in a jurisdiction, taking into account national rates and legislation.
The VAT gap figure for the EU has increased year-on-year since the EC started conducting analysis and publishing a survey of the findings in 2013.
“I urge member states to take the steps needed to fight tax evasion and tax fraud at all levels,” said Moscovici. “This remains a burning issue and is at the top of this Commission's agenda.”

Revision of figures
This year’s analysis showed a significant change to the way the data is gathered, and with it a revision of last year’s figures – which had shown the Netherlands to be the best VAT collectors in the EU.
The revision puts 2012’s VAT gap at €165 billion, down from the €177 billion initial estimate. It also puts Finland on top of the VAT collection table, with an impressively low VAT gap of 2.9%. In light of that figure, the increase of its VAT gap to 4.1% is something the authorities will want to address.
“The estimates for various components of the VTTL and consequently of the VAT gap for the years 2009-2012 have been revised (compared to the 2014 Report) on account of a number of factors,” said the report.
The most significant factor contributing to the changes was a downward revision of the VTTL for France, which decreased the estimated VAT gap by some €10 billion. New, unpublished information on the applicability of reduced- and super-reduced rates shows France has a narrower VAT base than previously thought.
The VAT gap estimate for 2012 of 15.2% is itself 0.9 percentage points lower than the estimate in the 2014 report, when it was estimated at 16.1%.
Country-by-country breakdown
The country with the most improved VAT collection was Malta, which shrunk its gap from 31.0% to 26.4%. It was followed by Latvia, which shrunk its VAT gap by 3.9 percentage points, or €87 million.
In 2013 – the year the study takes its data from – economic growth in the EU as a whole was still virtually non-existent, at 0.1%, although Latvia did see its economy expand by 4.2%, perhaps a reason why compliance – or at least proportional compliance – increased.
“In 2013, member states’ estimated VAT gaps ranged from the low of 4% in Finland, the Netherlands and Sweden, to the high of 41% in Romania,” said an EC press release.
“Fifteen member states including Latvia, Malta and Slovakia saw an improvement in their figures, [while] 11 member states such as Estonia and Poland saw deterioration.”
Across the EU, VAT revenues constituted 7% of GDP, a very similar level to previous years. This figure is at its highest in Denmark, at 9.6% - though the country was unknowingly a victim of a major fraud at the time – and lowest, at 5.8%, in Italy and Spain.
Italy, with its VAT gap of €47.5 billion, makes up a staggering 28% of the EU’s VAT gap in total, despite being accountable for less than 12% of EU GDP and population.
During 2013, there were also relatively few changes in VAT rates, compared with previous years of financial chaos which saw multiple adjustments as national governments used tax policy changes to try and maintain revenue inflows. Only Croatia, Cyprus, the Czech Republic, Finland and Slovenia made adjustments in 2013 – and the first two countries are not a part of this study. Luxembourg’s headline rate was the lowest in the EU, at 15%, while Hungary’s was the highest, at 27%.
ITR understands that the EU is considering a proposal to give member states more autonomy over VAT rates. This includes the already-confirmed step of discontinuing controls which say headline rates must be between 15% and 30%.
For more in-depth analysis of the VAT gap, look out for the October issue of International Tax Review.
Country |
2012 gap [revised] |
2013 gap |
% point change |
Austria |
11.1 |
11.4 |
0.3 |
Belgium |
11.2 |
10.5 |
-0.7 |
Bulgaria |
18.5 |
17.2 |
-1.3 |
Czech Rep. |
23.6 |
22.4 |
-1.2 |
Denmark |
8.5 |
9.3 |
0.8 |
Estonia |
13.3 |
16.8 |
3.5 |
Finland |
2.9 |
4.1 |
1.2 |
France |
9.4 |
8.9 |
-0.5 |
Germany |
10.6 |
11.2 |
0.6 |
Greece |
33.4 |
34 |
0.6 |
Hungary |
24.1 |
24.4 |
0.3 |
Ireland |
11.2 |
10.6 |
-0.6 |
Italy |
32 |
33.6 |
1.6 |
Latvia |
33.8 |
29.9 |
-3.9 |
Lithuania |
36.5 |
37.7 |
1.2 |
Luxembourg |
5.4 |
5.1 |
-0.3 |
Malta |
31 |
26.4 |
-4.6 |
Netherlands |
4.4 |
4.2 |
-0.2 |
Poland |
25.3 |
26.7 |
1.4 |
Portugal |
8.7 |
9 |
0.3 |
Romania |
42.9 |
41.1 |
-1.8 |
Slovakia |
38.6 |
34.9 |
-3.7 |
Slovenia |
9.1 |
5.8 |
-3.3 |
Spain |
17 |
16.5 |
-0.5 |
Sweden |
4.8 |
4.3 |
-0.5 |
UK |
10.5 |
9.8 |
-0.7 |
EU Average |
15.15 |
15.22 |
0.07 |
EU Total (€billions) |
165 |
168 |
2.775 |


