As a policy matter, many aspects of traditional tax planning involving intangible property (IP) have come under increasing scrutiny by global tax authorities and the broader international community. In 2014, issues relating to the transfer pricing of intangibles continued to dominate the tax landscape, with much of the discussion driven by the OECD's report on base erosion and profit shifting (BEPS), followed by an action plan and revised Discussion Draft on Transfer Pricing Aspects of Intangibles in 2013. The action plan identified 15 specific areas for further work, one of which calls for "ensuring that profits from intangibles are not divorced from value creation and special measures for hard-to-value intangibles". In the United States, Senator Max Baucus' Discussion Draft on Provision to Reform International Taxation, released November 2013, and the tax reform draft plan released by Congressman Dave Camp in February 2014 have sparked continued debate on how to keep companies from shifting profits from intangibles to low-tax jurisdictions.
For the media and entertainment industry, the key profit driver associated with intangibles involves proprietary content. Content is typically centrally owned and globally licenced intercompany for exploitation in each local market. Box office revenue is the most widely published indicator of a film's success, and as much as 50% of box office revenue is generated outside the United States. Most content in the media and entertainment industry is produced and owned in the United States: eight of the top 10 global media companies are US-based. With global audiences playing an increasingly important role, intercompany licensing of content to affiliates for local exploitation accounts for some of the biggest and most uncertain transactions for the industry.
A typical structure in the media industry is for a US affiliate to own the global IP and either licence the foreign rights to this IP to its distribution affiliates abroad, or engage the marketing and sales services of those affiliates. As the industry adapts to new digital distribution channels and increasingly selective audiences with a preference for locally tailored content, local media company affiliates are taking on increasing decision-making power and risk for their local markets. Given this backdrop, licencing is becoming more prevalent. The affiliates licence the content (say a movie, or a show), which is then shown in local movie theatres, distributed for video consumption either digitally or via DVD/Blu-ray, and shown on free and pay TV stations. But media companies also enter into similar transactions with unrelated distributors, creating a large pool of potentially comparable market transactions that should be carefully evaluated for comparability with intercompany licensing arrangements.
Under US Treas. Reg. §1.482-4(c), the comparable uncontrolled transactions (CUT) method evaluates the arm's-length nature of an intercompany charge by reference to comparable uncontrolled transactions. If an uncontrolled transaction involves the transfer of the same intangible under the same (or substantially the same) circumstances as the controlled transaction, this method will ordinarily provide the most reliable measure of an arm's-length charge. Circumstances are considered substantially the same if only minor, quantifiable differences exist for which appropriate adjustments can be made. Factors that are particularly relevant in determining comparability under the CUT method (besides the property itself) include contractual terms and economic conditions. For the intangible involved in the uncontrolled transaction to be considered comparable to the controlled intangible, both must have a similar profit potential, and be used in connection with similar products or processes within the same general industry or market. Other factors to be considered are the terms of the transfer, the stage of development, rights to receive updates, revisions or modifications, uniqueness of the property, duration of the licence, economic and product liability risks, existence of collateral transactions, and functions performed by the transferor and transferee.
In the media industry, each intercompany and third-party licencing transaction is often individually negotiated considering a number of industry-specific factors. These may include the genre, age of the content, Motion Picture Association of America (MPAA) rating, production budget, viewer ratings, the star of the show, type of content (movie or series), whether the licence includes rights to show on free or pay TV, as well as whether the content has local or global appeal.
Furthermore, an evaluation of the profit potential of a particular movie or show should consider all potential sources of revenue, including theatrical, home video, and advertising over the term of the licence or the life of the content.
The application of the CUT method for media companies is based mostly on internal comparable transactions that are not publicly disclosed. Therefore, little information about profitability and content value can be gleaned from public sources, other than production budget and box office revenue. To provide additional insight into what drives content revenue and profitability, Deloitte Tax used a database developed by Nash Information Services, LLC, the company behind www.the-numbers.com™. This article presents our findings based on an analysis of the data, which has so far been rarely available in complete and consistent form.
The data
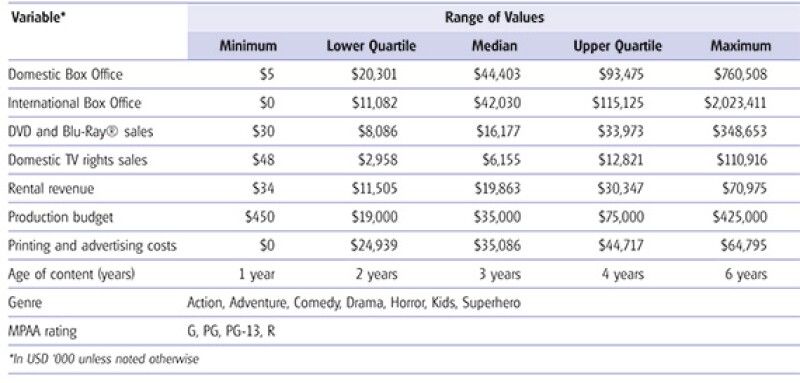
The data used for this study contained information on 646 movies and included 10 key variables for each (see Figure 1).
Figure 1 |
|
Deloitte Tax collaborated with www.the-numbers.com™ to get the most complete publically available data set, starting from over 20,000 titles released between 1915 and 2014. Any movies lacking information for the variables above were eliminated from the analysis. We then calculated three key indicators from a studio's perspective: total revenue to studio, total cost to studio, and return on investment (ROI). Industry sources such as Box Office Mojo report that, on average, studios retain approximately 55% of box office revenue. In addition, movie distributors may also retain 15-30% of gross receipts. However, our experience indicates that most major studios distribute their movies primarily through affiliated distributors. We therefore only considered payments to theatres in calculating the studios' revenue. Each indicator was calculated as follows:
Total Revenue to Studio = 55% ×
(Domestic Box Office + International Box Office) +
DVD and Blu-Ray® sales +
Domestic TV rights sales +
Rental revenue
Total Cost to Studio = Production budget + Printing and advertising costs
Return on Investment =
(Total Revenue to Studio - Total Cost to Studio) ÷
Total Cost to Studio
It is important to note that, given the general lack of reliable data for the media industry, several key pieces of information were not part of the dataset and therefore are not considered in this analysis. In terms of revenue, media companies often employ multiple additional channels to monetise content. These may include international TV rights sales, video on demand services, merchandising, as well as theme parks. The cost data is also incomplete, not accounting for many of the costs of creating and selling movies. Furthermore, after eliminating titles with incomplete information, the data may not be fully representative of all major types of movies. For example, our sample did not contain any documentaries or titles produced before 2008. Because of the lack of information about the timing of revenue, we did not make adjustments for the time value of money or inflation.
Despite these minor shortcomings, the dataset can still provide valuable insight into how genre, MPAA rating, revenue composition, age, and production budget may impact revenue and ROI.
Volatility
The media industry has been regarded as volatile and unpredictable. Studios, investors, and transfer pricing professionals have a profound interest in the ability to predict film profitability. Yet, as De Vany and Walls note in their article Does Hollywood Make Too Many R-Rated Movies: Risk, Stochastic Dominance, and the Illusion of Expectation (Journal of Business, 2002, vol.75, no.3), a film is an experiential good: until it is released, a motion picture is just an unknown, uncertain prospect. Accordingly, attempting to predict audiences' reactions to this class of products has proven difficult. Our dataset is no exception, and shows noticeable variability of ROIs even with the benefit of hindsight.
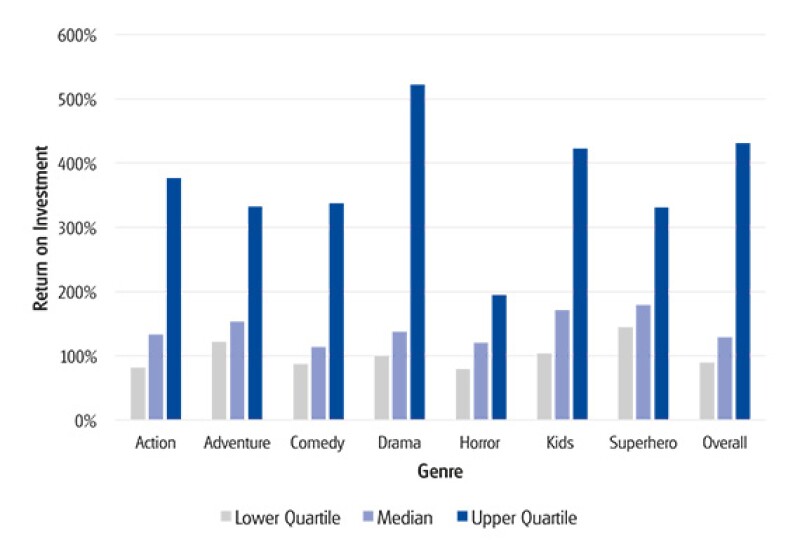
As can be seen from Figure 2 below, the interquartile range of ROIs for the entire data set varies widely from 89% at the lower quartile to 430% at the upper quartile, with a median of 128%. In addition, 187 titles out of our sample of 646, or almost 30%, had a negative ROI. The Fifth Estate had the lowest ROI at -88%, and Paranormal Activity had the highest, at 922%.
Figure 2: Interquartile range of ROI by genre |
|
Genre
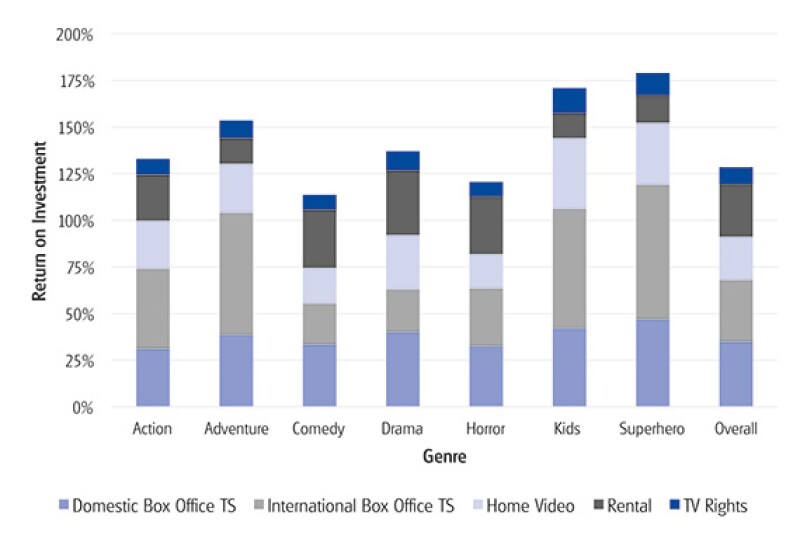
In terms of genre, the data reveal that the somewhat related categories of Kids and Superhero films generate the highest return on investment for studios at the median. One of the most interesting genres is Kids' films, which fall under two categories for the most part, live-action and animated, and are almost always rated G or PG. Digitally animated films produce high revenues, allowing these types of films to gain a reputation as the most profitable genres in the business. By contrast, live-action children's films have staggered behind in terms of overall performance. The breakaway success of such modern animated features as Frozen (2013) further reveals the drastic difference between the two. This PG-rated, digitally animated film had a net production cost amounting to $150,000,000, and skyrocketing ROI to studios of 428% less than a year after release. The median ROI by genre is shown in Figure 3.
Figure 3: Median ROI to studios by genre |
|
Important for transfer pricing purposes, the data indicate that median returns vary significantly from genre to genre. Comedies show the lowest median ROI, which is still well over 100%, and Superhero films lead the other genres. Another interesting finding is that while dramas do not produce the highest ROI most commonly, this genre has the highest possibility of very high returns, with an upper quartile of over 500% (see Figure 2).
MPAA rating
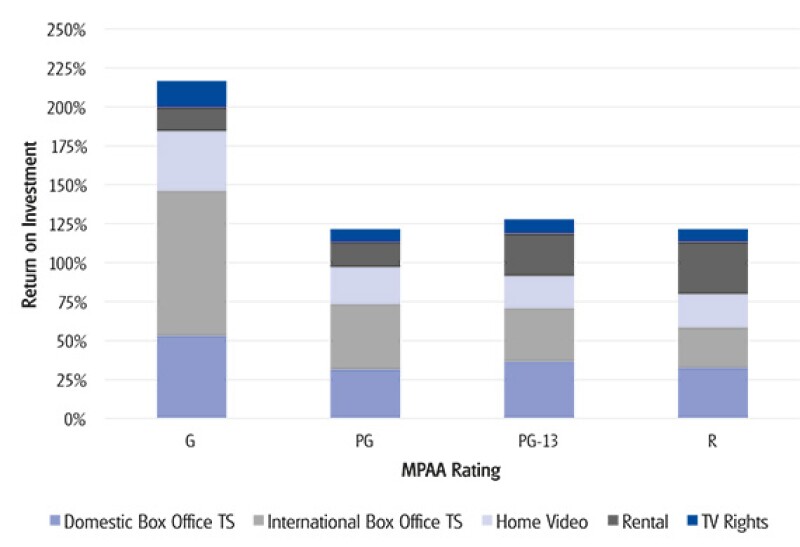
Industry sources report that a large portion of films released are R-rated. In fact, according to Vany and Wall's study, between 1985 and 1996, R-rated movies accounted for almost half of all movies released. Comparatively, only 3% were G-rated, 20% were PG-rated, and 25% PG13-rated. The Dove Foundation's Film Profitability Study 2012 (http://www.dove.org/reports/roi/) covering the period from 2005 through 2009 depicts similar figures, but there appears to be a trend away from R-rated films: their data indicate 38% of movies were R-rated, 41% PG13, 18% PG, and yet again 3% G-rated, marking the first time that the issuance of R-rated movies was overtaken by PG13-rated ones. The Dove Foundation further reports that PG13-rated films grew in production by 32% since their last study in 2005. One of the main reasons for this upward trend is that PG13-rated films have a larger potential audience and therefore profit potential, pulling in both adults and children (see Figure 4).
Figure 4: Median ROI to studios by MPAA rating |
|
The data suggest that G-rated films fare better overall, due to higher international appeal as reflected by international box office and home video revenue. While the sample of G-rated films in our data set was limited to 12 titles, these findings are consistent with the Dove Foundation's results for 2005 to 2009. According to this report, average profitability of R-rated films was only $12.7 million per film. G-rated films proved to be the most profitable, reaping $108.5 million in average profits. PG- and PG13-rated films fared better than R-rated films as well, with average profits of $65.5 million and $59.7 million, respectively. With the two studies showing that profitability can vary several-fold depending on rating, MPAA rating is another key comparability criterion for a CUT analysis in transfer pricing.
Life cycle
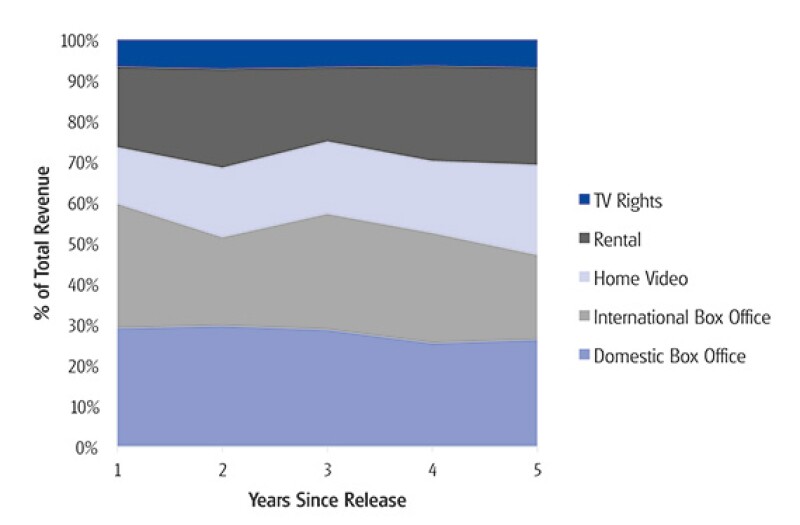
Unlike most goods bought and sold within a multinational group, which generate an immediate return, content can generate revenue for many years after its original release. The American television sitcom "I Love Lucy," originally launched in 1951, can still be seen on TV today and purchased on DVD and Blu-ray. Furthermore, the relative importance of different revenue streams changes over a film's life cycle, with box office revenues dominating in the first year, and other revenue sources becoming more important as time goes on. In an intercompany context, where one affiliate bears the cost and risk of production, another may be responsible for theatrical content distribution, and a third for home video distribution, these shifts in revenue over time have important implications. Our data show a marked decline in the proportion of box office revenue after year 3 and this is expected to continue throughout the life of the content (see Figure 5).
Figure 5: Revenue breakdown over five-year life cycle |
|
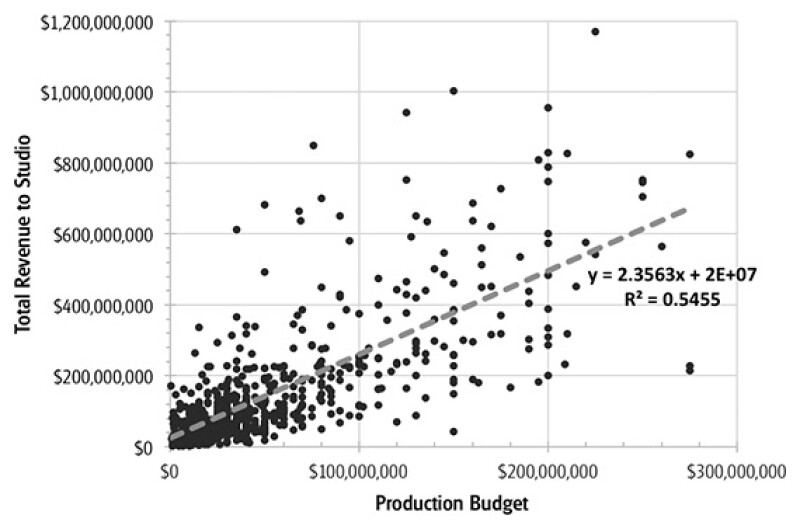
Figure 6: Total revenue to studios as a function of production budget |
|
Avatar was removed from the data set as an outlier for purposes of this figure. Avatar generated over $2 billion of revenue and had a production budget of $425 million. |
Production budget
Revenues do appear to be correlated with the production budget based on the data. As shown below, on average studios collect approximately $3.5 for every $1.0 spent on production, with the production budget explaining about 55% of the variation in revenue.
However, here again the high variability of the data should be noted, with a high production budget not constituting a guarantee of financial success. For example, the genre with the biggest box office return on investment is documentaries. According to Catherine Rampell of the New York Times' "Economix," documentaries typically have domestic box office returns averaging 12 times the original production budget. Globally, box office returns are nearly 27 times the original budget. This high rate of return should not be surprising, considering that documentaries are significantly cheaper to make, averaging $2.6 million in production budget as opposed to the $98 million the average action film requires.
Other factors
While the data presented here provides an overview of the key industry-specific comparability criteria for licencing content in the media industry, there are numerous other factors that should be considered in practice for a broad-based analysis. First of all, our data included only movies, but television content constitutes a significant portion of intercompany transactions and is increasingly important for the industry. Additional factors to consider include popularity/viewer ratings; the actors, producers, and other key stakeholders involved; and a more detailed examination of the age of the content. US studio release windows for new content are measured in weeks rather than years, and our data did not allow for this level of granularity. However, anecdotal evidence suggests that licence rates for 1st window content can be as much as double those for 2nd window content.
Conclusion
The appropriate pricing of intangible asset transactions within a multinational corporation is the top issue on the minds of taxpayers, tax authorities and advisers. For the media industry, this means being able to support the prices set for content licenced among affiliates. However, in an industry in which commentators have suggested that option pricing models would be most appropriate to analyse returns due to the level of uncertainty, this poses a distinctive set of challenges. The results presented in this paper only scratch the surface of the most important factors affecting the value and profit potential of motion picture content and demonstrate the importance of deep industry specialisation in the global transfer pricing arena.
The authors would like to thank Brian Green and Sasha Manevich for their contributions to this article.
Kristine Riisberg |
||

|
|
Principal Deloitte Tax LLP 1633 Broadway New York, NY 10019 Tel: +1 212 436 7917 Kristine Riisberg is a principal in Deloitte Tax's New York office. She has more than 16 years of transfer pricing and international tax experience with Deloitte, and spent four years in Deloitte's Washington National Tax Office. Kristine has extensive experience in company financial and quantitative research analysis and industry data analysis in a wide range of industries. She has prepared economic analyses, documentation, planning, competent authority requests, and cost sharing studies for clients in the following industries: media and entertainment, publishing, telecommunications, digital, computer software, semiconductors, consumer goods, high-end luxury goods, oil and gas upstream and field services sectors, power generation and renewable energy, chemicals, healthcare and medical, commodities, financial services, automotive and automotive suppliers, quick service restaurants and travel. With her international background and experience working in Deloitte transfer pricing teams in Copenhagen and London, Kristine has built up an extensive knowledge of global transfer pricing matters. Kristine is the global and US transfer pricing all industries programme leader, and the Americas transfer pricing leader of the technology, media & telecommunications industry programme. She has assumed the global lead tax partner role for the world's largest container shipping conglomerate, the global lead transfer pricing role for one of the world's largest media conglomerates, and the global lead transfer pricing role for the largest European-headquartered consumer and industrial goods conglomerate. Kristine has given numerous speeches and presentations for various groups, including the American Conference Institute, the Tax Executives Institute, BNA, Atlas, Thompson Reuters, CITE, Deloitte Dbriefs and conferences on transfer pricing issues. Most recently, she spoke on intangible property migration at Deloitte Tax's April 2014 Global US Investment Services and Transfer Pricing Group conference in Stockholm. Before joining Deloitte, Kristine was an international tax manager at Andersen's Copenhagen office. She also worked at the European Commission in Brussels in the Cabinet of the Danish Commissioner for Energy and Nuclear Safety. Kristine's most recent publications include the "Intangible Property Guide" for International Tax Review, January 23, 2014, and the "Technology, Media and Telecoms Guide" for International Tax Review, No. 82, September 10, 2013. |
Anna Soubbotina |
||

|
|
Senior manager Deloitte Tax LLP 1633 Broadway New York, NY 10019 Tel: +1 212 436 3952 Anna Soubbotina is an experienced senior manager in Deloitte Tax's global transfer pricing service line based in New York. She has eight years of specialised cross-border and multistate transfer pricing experience, and spent two years in Deloitte's Washington national tax office. Anna's focus is on intellectual property planning and cost-sharing projects involving the valuation of intangible assets, derivation of platform contribution payments, and development of royalty rates for the use of intellectual property. Anna's experience includes managing projects in the following industries: energy and power generation, chemical, industrial equipment and automation, software, financial services, healthcare, and media and entertainment. Anna has a proven track record consulting on a multitude of transfer pricing issues and the preparation of transfer pricing risk assessments under ASC 740, documentation, planning and audit defense studies, including cost allocation and services analyses, and tangible and intangible property. Anna manages and coordinates the preparation of global transfer pricing documentation for Deloitte Tax's largest clients, covering as many as 30 jurisdictions. Throughout this process, she ensures compliance with the US transfer pricing regulations, as well as consistency with the OECD transfer pricing guidelines. Anna works closely with Deloitte Tax's global network of specialists to bring clients the benefit of deep local-country transfer pricing expertise. Publications and Public Speaking Anna's publications include the "Intangible Property Guide" for International Tax Review, January 23, 2014, and the "Technology, Media and Telecoms Guide" for International Tax Review, No. 82, September 10, 2013. Anna has also designed and presented Deloitte Tax training on the following topics:
|


